
By Kathleen Brooks, research director at XTB
Gold is grabbing the headlines today, because, after a stunning rally, the price has fallen $18 so far on Tuesday. Today’s decline comes after a tremendous rally this month, the gold price is higher by more than 10%, that compares to a 3.1% rally for the S&P 500, and a 5.2% gain for the Nasdaq 100.
While the US government shutdown is looming over financial markets, month end flows may also be weighing on asset prices, as investors rebalance their portfolios before we move into Q4.
A pullback in the gold price from here is to be expected, the recent surge in the price of gold is more than two standard deviations compared to its long run mean, and gains could slow from here, as prices tend to mean revert.
However, the longer-term case is still supportive of further increases in the gold price. Dollar weakness, rising inflation expectations and the prospect of Fed rate cuts are all driving this gold rally. Added to this, there are also fears that the boom in AI stocks could be overdone, and that AI might not deliver the productivity and revenue gains that are expected. Gold is the ultimate hedge to dollar debasement, a global debt binge, a stock market bubble and inflation risks. None of these risks have gone away, which could keep demand for gold high.
It is also worth looking at the correlation analysis to see where gold goes next. The gold price has an inverse correlation with the dollar and since the start of this year, the gold price and the dollar have moved inversely to each other more than 50% of the time. As the dollar has fallen, the gold price has rallied.
With few drivers likely to boost the dollar, and a weaker greenback the likely path of least resistance during the expected US government shutdown, the upside momentum in the gold price is still intact, even if gains slow going forward. The yellow metal may not repeat September’s stunning performance, but a future above $4,000 an ounce is still a possibility.
Chart 1: Gold and the US dollar, 5-year chart. The inverse correlation has become notable since the start of this year.
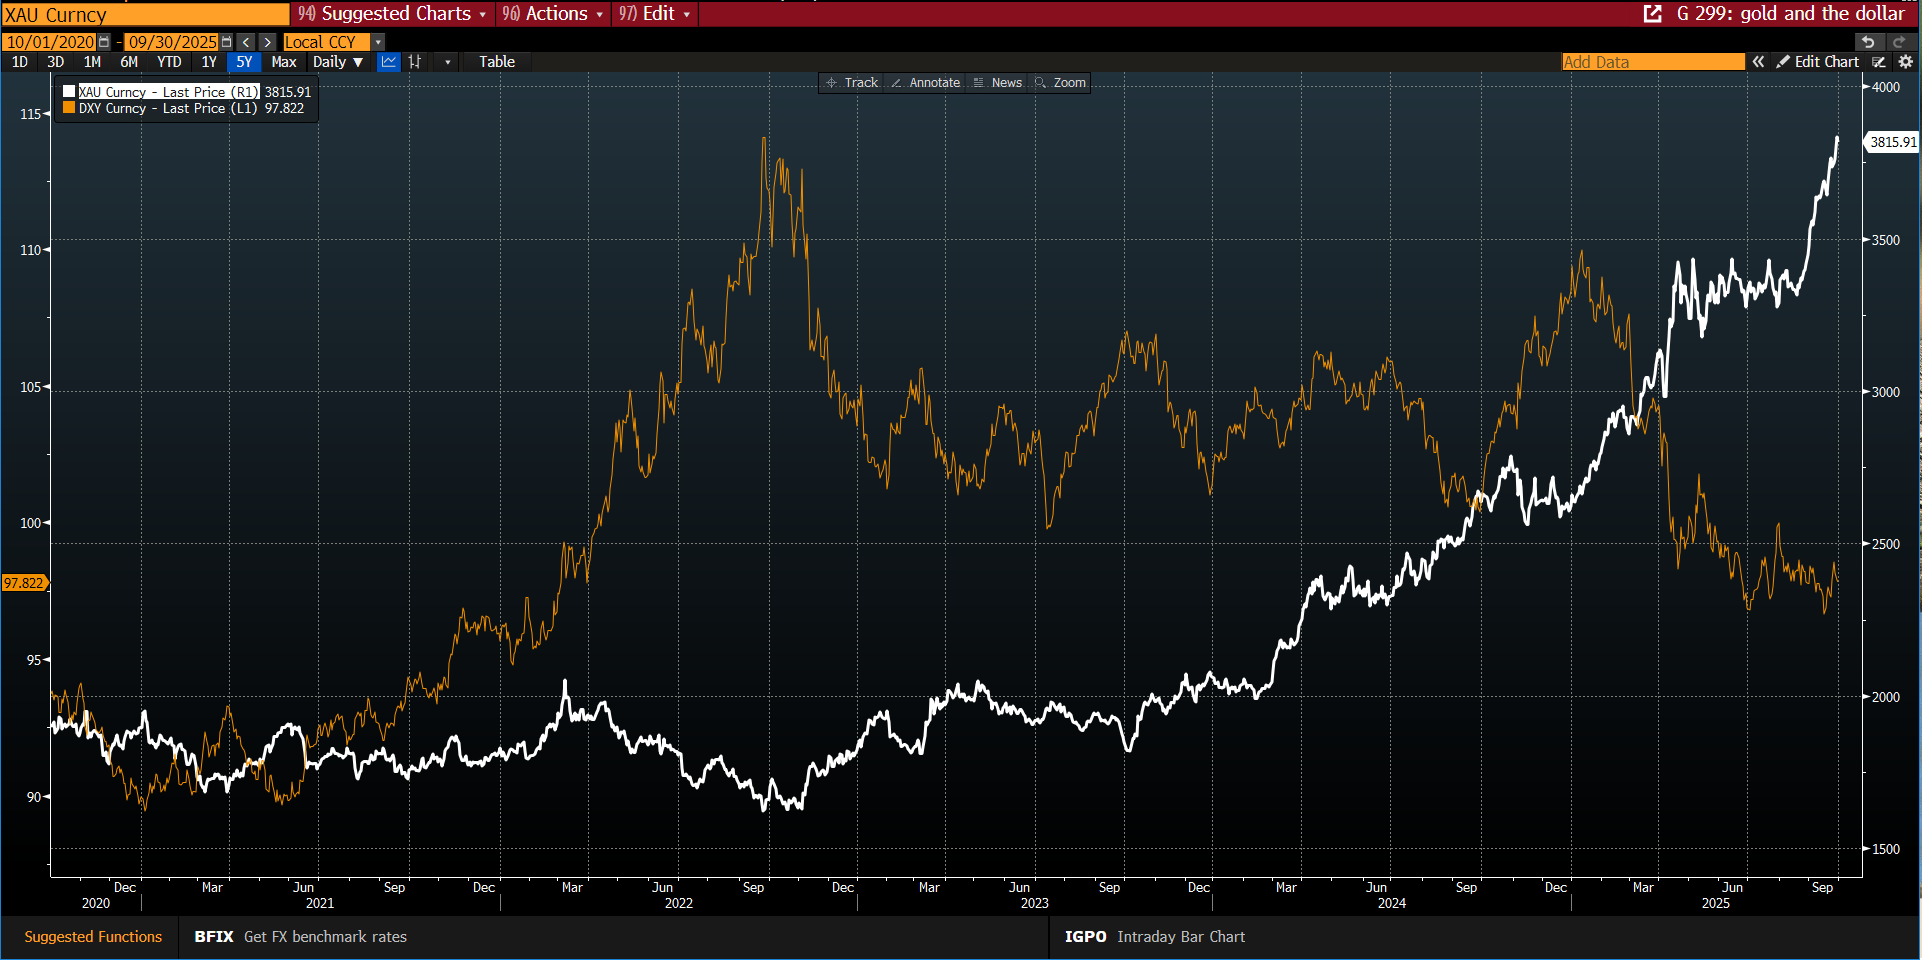
Source: XTB and Bloomberg

XTB CY-RISK DECLARATION: CFDs are complex instruments and come with a high risk of losing money rapidly due to leverage. 76% of retail investor accounts lose money when trading CFDs with this provider. You should consider whether you understand how CFDs work and whether you can afford to take the high risk of losing your money.
XTB UK-RISK DECLARATION: CFDs are complex instruments and come with a high risk of losing money rapidly due to leverage. 72% of retail investor accounts lose money when trading CFDs with XTB Limited UK. You should consider whether you understand how CFDs work and whether you can afford to take the high risk of losing your money.
XTB is a trademark of XTB Group. XTB Group includes but is not limited to following entities:
X-Trade Brokers DM SA is authorised and regulated by the Komisja Nadzoru Finansowego (KNF) in Poland
XTB Limited (UK) is authorised and regulated by the Financial Conduct Authority in United Kingdom (License No. FRN 522157)
XTB Limited (CY) is authorized and regulated by the Cyprus Securities and Exchange Commission in Cyprus. (License No.169/12)
Clients who opened an account from the 1st of January 2021 and are not residing in the UK, are clients of XTB Limited CY.